Author: Diego Serrano

NullPointerException

The Pulse of a PhD Final Exam

On Friday, September 14th, I defended my PhD thesis.  I have always had a tendency to anxious and easily agitated.  I wanted to see how my body reacts to the tense moments –almost 4 hours– of delivering a presentation and then answering questions of very smart people.  So, equipped with a FitBit Pulse 2, I monitored my heart rate during my thesis defense.

Before I describe the correlations between the activities and heart rates, in case you are wondering, I passed the exam!

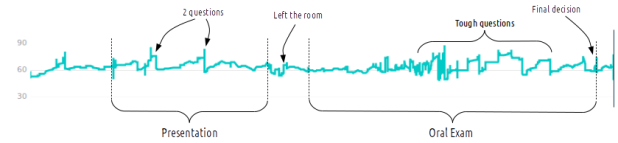
The figure shows the variation of beats per minute (bpm) over time.  The y-axis correspond to bpm, and the x-axis to time.  The readings start at 8:20 a.m.

pulse

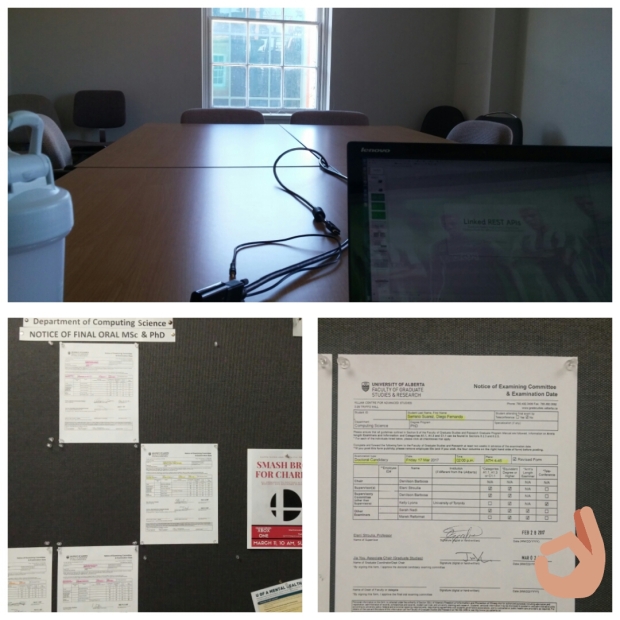
My day started at 5 a.m.  I have a very strict nutrition schedule, and I had to wake up to have my breakfast: eggs and oatmeal, as I didn’t want to feel heavy later.  Then, I called my mom, as I usually do, and by 7 am I was heading to the University.  Once I got to the lab, I went to the room where the thesis defense was scheduled.  I set up the connection between my computer and media equipment, and put a few pastries I brought for the audience.

At 8:30 a.m. I was starting to feel nervous, I was only 30 minutes away from the public seminar.  Everything was ready, and in my head I was repeating the first words of my presentation.  My supervisor asked me to install Skype because some evaluators will be joining a Skype conversation.  My heart beat went up a little beat, because I didn’t know if there was an installer for Ubuntu.  Obviously, I could install it without problems, but I was nervous.

The presentation started at 9 a.m.  I was nervous, but not too much, because I practiced the delivery of my presentation several times.  During the presentation, I was interrupted twice, because some attendants had questions.  You can see the spikes in beats per minute when I got those two questions.

After the presentation, I relaxed a little bit.  I went to the washroom, and then I ate a cookie so I can survive the next two hours.  When I went back into the room, the exam chair told me I had to leave the room.  Since I was nervous, my heart rate went up temporarily.

The exam started around 10:10 a.m., and I felt confident in the first questions.  Then, the questions became tougher and tougher.  I felt I had fever, and I am sure the color of my face was red intense.  However, I could answer the questions. I don’t remember much, though.  I was just too nervous.

Then the chair asked to step out the room while the evaluators deliberate.  After a few minutes, I was asked to enter the room.  One of the evaluators started a sentence with “I regret to tell you…” And that is the last spike in the heart beat figure.  A mini-heart attack.  But then he said, “… passed the exam, congratulations”.

During the whole process, the average beats per minute was about 62, and the highest was around 88.  Considering I was just standing or seated, the variation in heart rate seems significant.  And although I know the instrument I used to measure the heart beats per minute is not accurate, I did it just for fun.  The same reason I did a PhD, just for fun.

Plotting FIFA World Cup Players using PCA

In preparation for the best sports event, which will be held in Russia in a few months, I prepared some visualizations that shows the players of each of the countries that will be playing the FIFA World Cup Russia 2018.

The players are organized as if they form a constellation of stars, by using dimensionality reduction called Princial Component Analysis (PCA). With these technique I could represent more than 30 skills of the players (for example, acceleration, ball control, dribbling, speed, etc.) into a 2-D plane. The main goal of PCA is to reduce the dimensionality, while retaining the variation present in the dataset, up to the maximum extent.

Hence, having one player as a reference, for example Messi, we would say that players close to him are also good players, while players who are far from them may not be as good.

You can take a look at this link, which also contain more details about the methodology for each visualization:

webdocs.cs.ualberta.ca/~serranos/fifa.html

Linked REST APIs go to Hawaii

The paper “Linked REST APIs: A Middleware for Semantic REST API Integration” was presented in July at ICWS 2017, held in Honolulu, USA. [link]

Over the last decade, an exponentially increasing number of REST services have been providing a simple and straightforward syntax for accessing rich data resources. To use these services, however, developers have to understand “information-use contracts'” specified in natural language, and, to build applications that benefit from multiple existing services they have to map the underlying resource schemas in their code. This process is difficult and error-prone, especially as the number and overlap of the underlying services increases, and the mappings become opaque, difficult to maintain, and practically impossible to reuse. The more recent advent of the Linked Data formalisms can offer a solution to the challenge.

In this paper, we propose a conceptual framework for REST-service integration based on Linked Data models. In this framework, the data exposed by REST services is mapped to Linked Data schemas; based on these descriptions, we have developed a middleware that can automatically compose API calls to respond to data queries (in SPARQL). Furthermore, we have developed a RDF model for characterizing the access-control protocols of these APIs and the quality of the data they expose, so that our middleware can develop “legal” compositions with desired qualities. We report our experience with the implementation of a prototype that demonstrates the usefulness of our framework in the context of a research-data management application.

Authors: Diego Serrano, Eleni Stroulia, Diana Lau (IBM), Tinny Ng (IBM)

Research brings smart cities technology closer to reality

VIDEO from Global News

Imagine a city with less traffic, easy-to-find parking spots, and up-to-the-minute information about promotions and offerings at the stores and restaurants around you. A smart city. Even a smart campus.

Researchers at the University of Alberta are developing technology to make such a place a reality—right here in Edmonton.

“Smart cities are those that use technology to leverage existing data and current sensors to inform us about the world and improve our lives,” said Eleni Stroulia, professor in the Department of Computing Science. “We have the physical world sending messages about its status to the web, where computations can happen to inform, influence and even control the real physical world.”

Best of all, this type of technology can be put into action anywhere with rich historical data and robust sensors providing real-time information, making it useful, valuable and widely applicable.

In her graduate and undergraduate courses, Stroulia introduces students to the world of smart cities and the Internet of Things, encouraging them to develop their own ways of applying this technology to the real world.

Her students developed three projects last fall, each with useful applications in Edmonton: real-time traffic routing, parking stall monitoring, and location-based services on campus.

Traffic routing: This application, built by graduate student Diego Serrano and a team of undergraduate students, helps drivers find the best routes through traffic. Serrano used traffic data from the City of Edmonton, including historical data on accidents, speed, direction of traffic and congestion, as well as real-time data from traffic cameras and individual reports to build the application.

Parking stalls: Graduate student Sepehr Valipour developed an application that tells users where parking stalls on campus are available and how to get there, relying on easily available data from cameras in parking lots. The required infrastructure is already in place in some parking lots on campus and the software could soon be deployed to save energy and time.

Campus services: Graduate student Alexandr Petcovici fused information from wireless routers on campus, GPS technology and enterprises on campus to provide real-time location-based services to users on campus. Potential applications of Petcovici’s project range from alerting students about building closures to reducing food waste and energy loss.

More broadly, Stroulia explained, technology that builds smarter cities and campuses has near-infinite applications, from reducing waste to managing crisis situations and everything in between.

“These models can be applied anywhere with similar historical data and the necessary sensors. From conducting speedy evacuations to getting hungry students to leftover catering, the case for building smarter cities and campuses is very strong.”

The research was presented at the Institute of Electrical and Electronics Engineers World Forum on the Internet of Things in December 2016.


SOURCE: Faculty of Science, University of Alberta
https://www.ualberta.ca/science/science-news/2017/may/research-brings-smart-cities-technology-closer-to-reality

CSER Fall Meeting and CASCON 2016

During the Consortium for Software Engineering Research (CSER) 2016 Fall meeting, held on October 30th, I presented my talk of Building Linked REST APIs.  In this talk I address how we can use the same technology we use every day, to add semantics to Web APIs, and use those semantics to compose APIs automatically.  The presentation was awarded as the best presentation of the Fall meeting.

The Web of Data contains a myriad of structured information sources on a large number of domains. Nevertheless, most of the information is available through Web APIs that act as isolated silos of data that cannot interoperate automatically with other resources and services on the Web. In this talk, we discuss techniques to combine the easy data integration techniques offered by Linked Data technologies, with the flexibility and availability of web services. To achieve this goal, we propose: (a) a description language to semantically describe functional and non-functional components of web services, and the relationships among those components, and (b) a middleware that plans composition chains, based on user’s specifications, optimizing their trade-offs.

Additionally, I presented in CASCON the paper “From Relations to Multi-Dimensional Maps: A SQL-to-HBase Transformation Methodology”, which summarizes my work on SQL-to-HBase migration.

Understanding Collaborative Research Output

Poster presented at VIVO 2016, held in Denver, USA. The poster can be seen here.

Multidisciplinarity and collaboration are increasingly recognized as necessary in order to exchange knowledge across disciplines, foster learning, and address problems that transcend a single distinct academic field.

Existing bibliometric measures, such as citation counts and the h-index tend to reinforce research output within a single field.

Going beyond counts of publications and citations, we are interested in analyzing and quantifying the degree to which a researcher, a research activity, and a set of research outputs are collaborative and multidisciplinary. Further, we seek to understand how these new measures compare with more traditional measures of productivity.

In this poster, we present the results of our comparative analysis of several measures of research output for a large multidisciplinary team.

Authors: Diego Serrano, Yunpeng Li, David Turner, Emily Maemura, Kelly Lyons, Eleni Stroulia